2018년 4월 4일 수요일

Druid 구조


[ Architecture ]


참고 > http://www.popit.kr/time-series-olap-druid-%EC%9E%85%EB%AC%B8/


실시간 데이터의 경우 : real-time node > deep storage에 저장
배치 데이터 : deep stroage에 저장

mySql : druid 관련 메타정보 저장
coordinator : 메타정보를 통해 segment life cycle 관리
zookeeper : druid 내부 컴포넌트간 통신
broker : 사용자 query


[ Indexing Service ]


indexing : segment를 생성하거나 삭제하는 역할

Druid의 indexing service는 위의 도식과 같이 세가지 컴포넌트로 구성된다.
1. Peon : 단일 jvm에서 수행되는 하나의 태스크를 말하며 Middle Manager에 의해 생성된다.
2: Middle Manager : 요청된 작업 분배 등의 Peon을 관리하는 역할을 수행한다.
3: Overload는 task의 분산을 관리하며 local또는 remote의 다수의 Middle Manager를 구성할 수 있다.

indexing을 위해서는 Overlord node 를 통해 다음과 같은 URI에 수집 spec json을 포함하여 인덱싱 요청을 보낸다. 이때는 수집 대상 정보와 인덱싱을 위한 스키마 정보 등이 포함되며 수집 task가 생성된다.
http://<OVERLORD_IP>:<port>/druid/indexer/v1/task

 = data를 load 한다는 뜻.


2018년 3월 28일 수요일

Druid Ingestion & Querying


[ Druid Data set ]


Druid의 모든 데이터는 Time 기준의 Segment라는 단위로 저장하고, 이 segment는  Timestamp, Dimension, Measure 이 세가지 필수 요소로 구성되어 있다.


- Timestamp : 모든 query는 time을 기반으로 실행

- Dimension : event의 string 속성들
- Measure : 실제 집계할 컬럼. 


[ Data Ingestion ]


1. hadoop dir(http://bisnapshotm01.ssgbi.com:50070/explorer.html#/)에 create external로 데이터를 떨군다.


2. JSON 형식의 데이터 로드 쿼리를 overlord node(8090)로 submit 한다.


> disp_ctg_load.json 

{
  "type": "index_hadoop",
  "spec": {
    "ioConfig": {
      "type": "hadoop",
      "inputSpec": {
        "type": "static",
        "paths": "/apps/hive/warehouse/snapshot.db/disp_ctg_item_all_column/"
      }
    },
    "dataSchema": {
      "dataSource": "DISP_CTG_ITEM__ORG_ITEM",
      "granularitySpec": {
        "type": "uniform",
        "segmentGranularity": "day",
        "queryGranularity": "day",
        "intervals": [ "2017-01-01/2018-01-01" ]
      },
      "parser": {
        "type": "hadoopyString",
        "parseSpec": {
          "format": "tsv",
          "columns": [
            "기준일자",
            "전시카테고리ID",
            "표준카테고리ID",
            "상품ID",
              .........
          ],
          "delimiter": "\t",
          "dimensionsSpec": {
            "dimensions": [
              "기준일자",
              "전시카테고리ID",
              "표준카테고리ID",
               ....
            ]
          },
          "timestampSpec": {
            "format": "auto",
            "column": "기준일자"
          }
        }
      },
      "metricsSpec": [
        {
          "name": "상품ID",
          "type": "hyperUnique",
          "fieldName": "상품ID"
        }
      ]
    },
    "tuningConfig": {
      "type": "hadoop",
      "partitionsSpec": {
        "type": "hashed",
        "targetPartitionSize": 5000000
      },
      "jobProperties": { }
    }
  }
}        

> http curl command

 curl -X 'POST' -H 'Content-Type:application/json' -d @disp_ctg_load.json   bisnapshotd01.ssgbi.com:8090/druid/indexer/v1/task

이 때, segmentGranularity <= queryGranularity 이 성립.

(granularity :  all, none, second, minute, fifteen_minute, thirty_minute, hour, day, week, month, quarter and year.)


overlord submit 후에, MR JOB이 2번 실행된다.

 1) Determine partitions
    : 설정 정보(Granularity, tuningConfig 등)에 따라 segment의 shard 개수를 결정하는 작업이다.


 2) Index Generation
    : index segment를 수행하는 작업이다. (segment 생성)
      time 단위로 데이터를 sharding 하며, sharding 된 데이터를 segment라고 한다.
      이 과정이 끝나면 broker node로 해당 데이터 소스에 대한 query가 가능하다.


* ingestion 과정에서 map, reduce 메모리 오류가 나서, 각각 16GB로 늘려주었다.


3. Delete data

 : 3단계가 필요하다.

  1) disable datasource

    curl -X 'DELETE' "bisnapshotd01.ssgbi.com:8081/druid/coordinator/v1/datasources/DISP_CTG_ITEM__ORG_ITEM"

  2) delete data - 삭제할 interval을 설정해주어야 한다. (coordinator에 kill task 올라옴)
    curl -X 'DELETE' bisnapshotd01.ssgbi.com:8081/druid/coordinator/v1/datasources/DISP_CTG_ITEM__ORG_ITEM/intervals/2017-01-01T00:00:00Z_2018-01-01T00:00:00Z

  3) enable datasource
    curl -X 'POST' "bisnapshotd01.ssgbi.com:8081/druid/coordinator/v1/datasources/DISP_CTG_ITEM__ORG_ITEM"


* Granularity


> 아래 세가지는 query 시, granularity
 1) simple granularity

 : all, none, second, minute, fifteen_minute, thirty_minute, hour, day, week, month, quarter and year 

 2) duration granularity

 "granularity" : {"type" : "duration", "duration": 3600000, "origin": "2012-01-01T00:30:00Z"}
 -> "2012-01-01T00:30:00Z" 이 시각을 기준으로, 1시간 단위 집계

 3) period granularity

 "granularity" : {"type" : "period ", "period ": P3M, "origin": "2012-01-01T00:00:00Z"}
 -> "2012-01-01T00:00:00Z" 이 시각을 기준으로, 3개월 단위 집계

> 아래는  data ingestion 시, segmentGranularity

Enum Constants
Enum Constant and Description
ALL 
DAY 
FIFTEEN_MINUTE 
FIVE_MINUTE 
HOUR 
MINUTE 
MONTH 
NONE 
QUARTER 
SECOND 
SIX_HOUR 
TEN_MINUTE 
THIRTY_MINUTE 
WEEK 
YEAR


=>  "granularitySpec": {
        "type": "period",
        "segmentGranularity": {"type":"period", "period":"P3D"},      -- ISO 8601 방식 
        "queryGranularity": "day",
        "intervals": [ "2017-01-01/2017-01-08" ]
      },

 왜 때문인지 열흘 ingestion 하는 데, map,reduce 메모리를 많이 잡아먹음. period 때문 ?
  (개발서버에서 일주일치 올리는데 1:46:33 소요.)

> 2017-01-01/2017-01-08, P3D로 올렸는데, 실제로는 2016-12-31/2017-01-03/2017-01-06으로 나누어져 올라감
> 2017-01-01부터 3DAYS로 나누려면, segmentGranularity에 "origin": "2017-01-01"를 설정해주면 된다.

groupby query 결과,


/*
3day segment로 올렸을때,
*/

1)

SELECT 기준일자, COUNT(DISTINCT 상품ID) FROM HDFS_DISP_CTG_ITEM_ALL_COLUMN_20180403 WHERE 기준일자 BETWEEN '20170101' AND '20170107'  GROUP BY 기준일자 ORDER BY 기준일자


{

  "queryType": "groupBy",
  "dataSource": "DISP_CTG_ITEM__ORG_ITEM_0403",
  "dimensions": [
        ],
  "granularity": "day",
  "aggregations": [
    {
          "type": "distinctCount",
          "name": "상품수",
          "fieldName": "상품ID"
    }
  ],
  "intervals": [
   "2017-01-01T00:00:00/2017-01-08T00:00:00"
  ]

}


-- 오차율 0%


2)

SELECT COUNT(DISTINCT 상품ID) FROM HDFS_DISP_CTG_ITEM_ALL_COLUMN_20180403 WHERE 기준일자 BETWEEN '20161231' AND '20170102'

{

  "queryType": "groupBy",
  "dataSource": "DISP_CTG_ITEM__ORG_ITEM_0403",
  "dimensions": [
        ],
  "granularity": {"type":"period", "period":"P3D"},
  "aggregations": [
    {
          "type": "distinctCount",
          "name": "상품수",
          "fieldName": "상품ID"
    }
  ],
  "intervals": [
   "2017-01-01T00:00:00/2017-01-08T00:00:00"
  ]

}


-- 오차율 0%

3) segmentGranularity (P3D) 보다 작은 단위 (약수단위)로 GROUPBY SELECT 했을 때 

오차율 0% -> 예를 들면, segmentGranularity=P6D면, 1,2,3,6일 단위로 GROUPBY 하면 정합성 100%

"granularity": {"type":"period", "period":"P1D"},


SELECT COUNT(DISTINCT 상품ID) FROM HDFS_DISP_CTG_ITEM_ALL_COLUMN_20180403 WHERE 기준일자 ='20170101'


-- 오차율 0%


* ISO 8601 형식 

기간 : 기간 표현의 시작을 알리는 기간지정자 P(period)로 시작. T는 시간표현 앞에 오는 시간 지정자.
         = P<date>T<time>
        -> P[n]Y[n]M[n]DT[n]H[n]M[n]S / P[n]W 형식으로 표현된다.


[ Querying ]

 : HTTP REST 방식으로 Broker node(8082)에 쿼리한다. (query : json format)

 curl -X POST 'bisnapshotm01.ssgbi.com:8082/druid/v2/?pretty' -H 'Content-Type:application/json' -d @query.json -w %{time_total} > out.json


json 형식의 쿼리는 'Druid Distinct count 성능테스트'에서 함께 설명.


* 참고

http://druid.io/docs/0.12.0/design/index.html
https://www.slideshare.net/freepsw/olap-for-big-data-druid-vs-apache-kylin-vs-apache-lens
http://www.popit.kr/time-series-olap-druid-%EC%9E%85%EB%AC%B8/

Druid Groupby Distinct Count 성능 테스트


[ Distinct count ]

성능테스트에 앞서, Druid 기본 설정으로는 Distinct count aggregation을 지원하지 않는다.
Distinct count aggregation 을 사용하기 위해서는 druid-distinctcount extension을 모든 데이터노드(d01~d08)와, 마스터노드(m01)에 별도로 설치해야한다.

루트 디렉토리에서 pull-deps tool로 설치할 수도 있지만, 방화벽 문제로 인터넷 접근을 통한 extension 설치는 불가능했다.
(java -classpath "/usr/hdp/2.6.3.0-235/druid/lib/*" io.druid.cli.Main tools pull-deps --defaultVersion 0.10.1 --clean -c io.druid.extensions.contrib:druid-distinctcount)

따라서 distinctcount jar 파일을 별도로 다운받아서, 각 데이터노드, 마스터노드의 다음 경로에 extension 디렉토리를 만들어주었다. 
/usr/hdp/2.6.3.0-235/druid/extensions


마지막으로, ambari에서 druid.extensions.loadList 에 해당 extensions만 include 해주면 된다. 


[ Groupby query ]

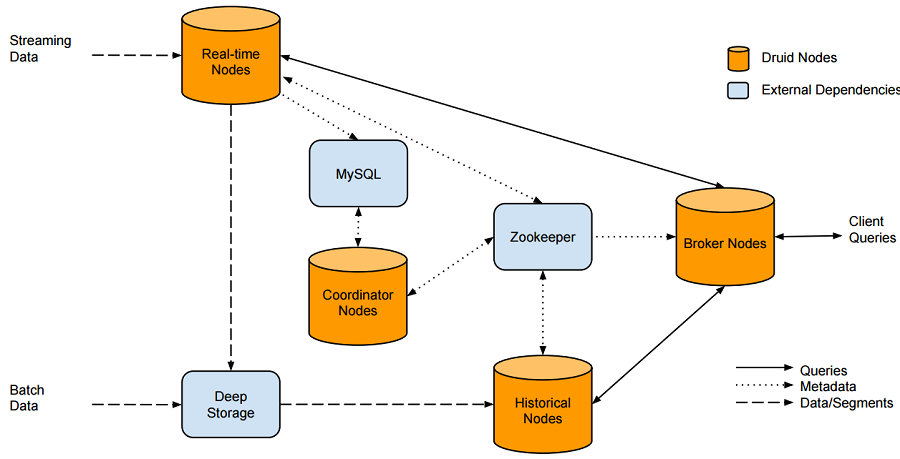
우선 Druid에서는 데이터를 time 기준의segment라는 단위로 저장하고, SegmentGranularity 라는 기준 하에 저장 단위가 정해진다. 
(예를 들어 SegmentGranularity = day : data가 day단위의 segment로 나뉘어 저장됨)

따라서 Druid는 timestamp column이 될 수 있는 날짜 속성의 컬럼이 필수로 로드되어야 하며
이 컬럼과 지정한 SegmentGranularity에 따라 데이터가 나뉘어 저장된다.

데이터가 나뉘어 저장되다 보니
단순 Group by Distinct count를 할 때에 날짜가 뭉개지지 않는 문제가 있었고 (segment별 distinct count 후, Sum 한 값으로 결과가 나옴),
날짜(segment)를 뭉개기 위한 대안으로는 Nested Group by를 사용해야 했다. (group by select 후, group by count)

즉, 날짜 속성 컬럼(DT)가 Group By 디멘전에 속해 있을 경우에는 단순 Groupby로 PDW보다 빠르게 결과가 나왔고,


DT 없이 Group by를 할 경우에는 Nested Group by를 사용해야 정확한 결과가 나오기 때문에, PDW보다 느릴 수 밖에 없다.


(1) 일자 포함, 단순 Groupby Distinct count

SELECT 기준일자, COUNT(DISTINCT 상품ID) AS 상품수 
FROM DISP_CTG_ITEM__ORG_ITEM_20180319 
WHERE 기준일자 >= '20170101' AND 기준일자 < '20170201'
GROUP BY 기준일자 
ORDER BY 기준일자

{
  "queryType": "groupBy",
  "dataSource": "DISP_CTG_ITEM__ORG_ITEM_20180319",
  "dimensions": ["기준일자"],
  "limitSpec": { "type": "default", "columns": ["기준일자"] }, 
  "granularity": "ALL",
  "aggregations": [
    {
      "type": "distinctCount",
      "name": "상품수",
      "fieldName": "상품ID"
    }
  ],
  "intervals": [
   "2017-01-01T00:00:00/2017-02-01T00:00:00"
  ]
}


(2) 일자 미포함, Nested Groupby

SELECT COUNT(상품ID) AS 상품수 
FROM  (
  SELECT 상품ID 
  FROM DISP_CTG_ITEM_ALL_COLUMN_SUSEONG
  WHERE 기준일자 >= '20170101' AND 기준일자 < '20170102'
  GROUP BY 상품ID
) A


{
  "queryType": "groupBy",
  "dataSource": {
        "type": "query",
        "query": {
                "queryType": "groupBy",
                "dataSource": "DISP_CTG_ITEM__ORG_ITEM_20180319",
                "dimensions": ["상품ID"],
                "granularity": "ALL",
                "intervals": ["2017-01-01/2017-02-01"]
        }
  },
  "dimensions": [ ],
  "granularity": "all",
  "aggregations": [
    {
          "type": "count",
          "name": "상품수",
          "fieldName": "상품ID"
    }
  ],
  "intervals": [
   "2017-01-01T00:00:00/2017-02-01T00:00:00"
  ]
}


[ Druid 성능 테스트 ]


1. Druid 데이터 로드 (1 테이블, 49 컬럼)


DRUID
1일
0:09:15
7일
0:11:22
1개월
0:22:00


2. COUNT(DISTINCT 상품ID)  -- DT 미포함, Nested Groupby


DRUID
PDW
오차율
DRUID_SQL
1일
0:00:18
0:00:09
0%
00:00:18
7일
0:00:19
0:00:18
0%
00:00:29
1개월
0:00:40
0:00:24
0%
00:00:42
3개월
0:00:51
0:00:16
0%
-


3. COUNT(DISTINCT 상품ID) GROUP BY 기준일자 -- DT 포함, 단순 Groupby


DRUID
PDW
오차율
DRUID_SQL
1일
0:00:02
0:00:02
0%
00:00:29
7일
0:00:01
0:00:06
0%
00:01:02
1개월
0:00:01
0:00:05
0%
error
3개월
0:00:02
0:00:10
0%
-


4. COUNT(DISTINCT 상품ID) GROUP BY 5컬럼     --DT 포함, 단순 Groupby


DRUID
PDW
오차율
DRUID_SQL
1일
0:00:02
0:00:22
0%
00:00:39
7일
0:00:03
0:00:38
0%
00:01:51
1개월
0:00:08
0:01:02
0%
error
3개월
0:00:09
0:00:37
0%
-


COUNT(DISTINCT 상품ID) GROUP BY 5컬럼     -- DT 미포함, Nester Groupby


DRUID
PDW
오차율
DRUID_SQL
1일
0:00:39
0:00:13
0%
0:00:38
7일
0:01:23
0:00:10
0%
0:01:05
1개월
0:01:20
0:00:18
0%
0:01:38
3개월
0:02:49
0:00:43
0%
-

* Druid 쿼리성능 테스트를 하면서 있었던 이슈는, 대부분 java heap space / gc overhead limit exceeded 이슈였고, 
이 문제는 historical node와 broker node의 jvm memory 증가, 그리고 jvm option '-XX:+UseG1GC -XX:-ResizePLAB -XX:+PrintFlagsFinal' (대용량대비 가비지 콜렉터 수정)' 설정을 통해서 해결하였습니다.


* 20180410 DRUID SQL 테스트

- broker 설정에 아래 두 항목을 추가해야함.
  druid.sql.enable = true
  druid.sql.planner.useApproximateCountDistinct = false

- json파일
 {"query":"SELECT COUNT(*) FROM DISP_CTG_ITEM__ORG_ITEM_20180319"}

- 명령어
 curl -XPOST -H'Content-Type: application/json' bisnapshotm01.ssgbi.com:8082/druid/v2/sql/ -d @sql.json

- "error":"Resource limit exceeded","errorMessage":"Not enough aggregation buffer space to execute this query. Try increasing druid.processing.buffer.sizeBytes or enable disk spilling by setting druid.query.groupBy.maxOnDiskStorage to a positive number."

-> broker와 historical의 druid.processing.buffer.sizeBytes를 늘려주었다


--------------------------------------------------------------------------
* 20180406 session 갯수 대비 성능 테스트


1. COUNT(DISTINCT 상품ID)  -- DT 미포함, Nested Groupby


1개
2개
4개
10개
1일
0:00:18
min
0:00:22
min
0:00:17
min
0:00:24
max
0:00:22
max
0:00:18
max
0:00:47
avg
0:00:22
avg
0:00:18
avg
0:00:36
7일
0:00:18
min
0:00:46
min
0:00:31
min
0:01:15
max
0:00:47
max
0:00:40
max
0:01:57
avg
0:00:47
avg
0:00:36
avg
0:01:36
1개월
0:00:40
min
0:01:10
min
0:00:52
min
0:02:07
max
0:01:10
max
0:00:57
max
0:03:00
avg
0:01:10
avg
0:00:55
avg
0:02:34
3개월
0:00:51
min
0:01:01
min
0:01:27
min
0:03:10
max
0:01:02
max
0:01:27
max
0:04:22
avg
0:01:02
avg
0:01:27
avg
0:03:46


2. COUNT(DISTINCT 상품ID) GROUP BY 기준일자 -- DT 포함, 단순 Groupby


1개
2개
4개
10개
1일
0:00:02
min
0:00:01
min
0:00:01
min
0:00:01
max
0:00:01
max
0:00:01
max
0:00:01
avg
0:00:01
avg
0:00:01
avg
0:00:01
7일
0:00:01
min
0:00:01
min
0:00:01
min
0:00:01
max
0:00:01
max
0:00:01
max
0:00:01
avg
0:00:01
avg
0:00:01
avg
0:00:01
1개월
0:00:01
min
0:00:03
min
0:00:01
min
0:00:03
max
0:00:03
max
0:00:01
max
0:00:04
avg
0:00:03
avg
0:00:01
avg
0:00:04
3개월
0:00:02
min
0:00:02
min
0:00:04
min
0:00:07
max
0:00:02
max
0:00:05
max
0:00:08
avg
0:00:02
avg
0:00:05
avg
0:00:08


3. COUNT(DISTINCT 상품ID) GROUP BY 5컬럼     --DT 포함, 단순 Groupby


1개
2개
4개
10개
1일
0:00:02
min
0:00:01
min
0:00:01
min
0:00:01
max
0:00:02
max
0:00:02
max
0:00:02
avg
0:00:02
avg
0:00:02
avg
0:00:02
7일
0:00:03
min
0:00:01
min
0:00:02
min
0:00:02
max
0:00:02
max
0:00:02
max
0:00:03
avg
0:00:02
avg
0:00:02
avg
0:00:03
1개월
0:00:08
min
0:00:02
min
0:00:03
min
0:00:06
max
0:00:02
max
0:00:04
max
0:00:10
avg
0:00:02
avg
0:00:04
avg
0:00:08
3개월
0:00:09
min
0:00:08
min
0:00:08
min
0:00:17
max
0:00:08
max
0:00:09
max
0:00:22
avg
0:00:08
avg
0:00:09
avg
0:00:20


4. COUNT(DISTINCT 상품ID) GROUP BY 5컬럼     -- DT 미포함, Nester Groupby


1개
2개
4개
10개
1일
0:00:39
min
0:00:50
min
0:00:43
min
0:00:43
max
0:00:50
max
0:00:43
max
0:01:32
avg
0:00:50
avg
0:00:43
avg
0:01:38
7일
0:01:23
min
0:01:52
min
0:01:24
min
0:01:43
max
0:02:06
max
0:01:54
max
0:03:34
avg
0:01:59
avg
0:01:39
avg
0:02:39
1개월
0:01:20
min
0:02:10
min
0:02:23
min
0:02:57
max
0:02:22
max
0:02:35
max
0:05:17
avg
0:02:16
avg
0:02:29
avg
0:04:17
3개월
0:02:49
min
0:03:16
min
0:03:53
min
0:05:02
max
0:03:17
max
0:03:57
max
0:08:24
avg
0:03:17
avg
0:03:55
avg
0:06:43